Parabolic SAR Buy Zone📈 Parabolic SAR Buy Zone — Early Trend Reversal Indicator
This script highlights bullish reversals based on the Parabolic SAR (Stop and Reverse) indicator.
🧠 Key Features:
Uses SAR parameters: Start: 0.02, Increment: 0.005, Max: 0.2
Visually marks the Buy Zone when SAR falls below the price
Background is light blue to show accumulation or early reversal zones
Yellow SAR dots help identify trend direction and potential exits
Includes alerts when SAR flips from bearish to bullish, signaling potential entry points
✅ Best Used For:
Identifying early trend reversals
Swing trading setups on daily or weekly charts
Combining with volume, RSI, or support zones for confirmation
🛎️ Customize alert to stay notified when new buy zones appear on your favorite stocks or cryptos.
Cari skrip untuk "swing trading"

Reversal Radar
**Reversal Radar - Multi-Indicator Confirmation System**
This script combines five proven technical analysis methods into a unified reversal signal, reducing false signals through multi-indicator confirmation.
**INDICATORS USED:**
1. ADX/Directional Movement System
Determines trend direction via +DI and -DI comparison. Signal only during downtrend condition (DI- > DI+). Filters out sideways markets.
2. Custom Linear Regression Momentum
Proprietary momentum calculation based on linear regression. Measures price deviation from Keltner Channel midline. Signal on negative but rising momentum (beginning trend reversal).
3. Williams VIX Fix (WVF)
Identifies panic-selling phases. Calculates relative distance to recent high. Signal when exceeding Bollinger Bands or historical percentiles.
4. RSI Oversold Filter
Default RSI < 35 (adjustable 30-40). Filters only oversold zones for reversal setups.
5. MACD Confirmation
Signal only when MACD below zero line and below signal line. Confirms ongoing weakness before potential reversal.
**FUNCTIONALITY:**
The system generates a BUY signal only when ALL activated filters are simultaneously met. Each indicator can be individually enabled/disabled. Flexible parameter adjustment for different markets/timeframes. Reduces false signals through multi-confirmation.
**APPLICATION:**
Suitable for swing trading on higher timeframes (4H, Daily), reversal strategies in oversold markets, and combination with additional confirmation indicators.
Setup: Activate desired filters, adjust parameters to market/timeframe, check BUY signal as entry opportunity. Additional confirmation through volume/support recommended.
**INNOVATION:**
The Custom Linear Regression Momentum is a proprietary development combining Keltner Channel logic with linear regression for more precise momentum detection than standard oscillators.
**DISCLAIMER:**
This tool serves as technical analysis support. No signal should be traded without additional confirmation and risk management.

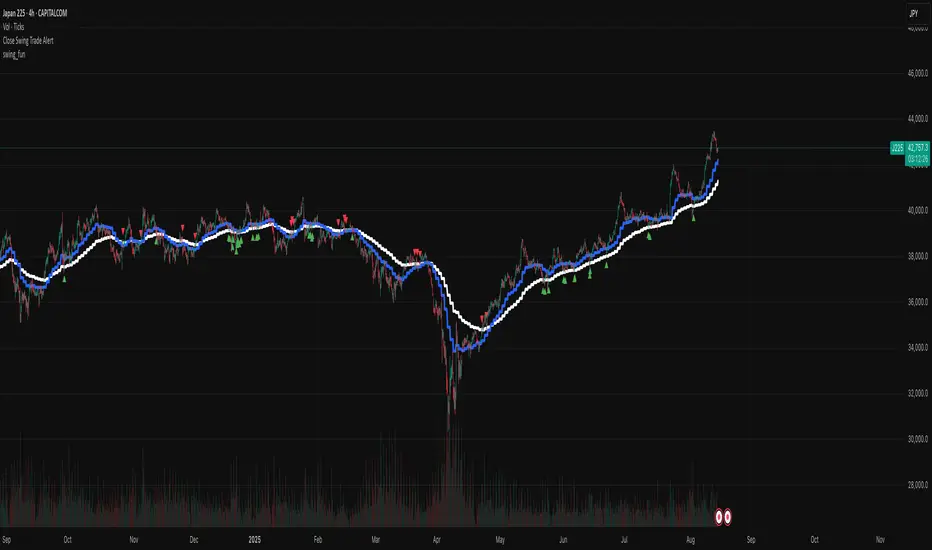
swing_funThis is a very simple swing trading entry point indicator, design to be used on the indexes with the 4hr chart. It gives alerts whenever a long or short signal is found.
Time-Price Velocity [QuantAlgo]🟢 Overview
The Time-Price Velocity indicator uses advanced velocity-based analysis to measure the rate of price change normalized against typical market movement, creating a dynamic momentum oscillator that identifies market acceleration patterns and momentum shifts. Unlike traditional momentum indicators that focus solely on price change magnitude, this indicator incorporates time-weighted displacement calculations and ATR normalization to create a sophisticated velocity measurement system that adapts to varying market volatility conditions.
This indicator displays a velocity signal line that oscillates around zero, with positive values indicating upward price velocity and negative values indicating downward price velocity. The signal incorporates acceleration background columns and statistical normalization to help traders identify momentum shifts and potential reversal or continuation opportunities across different timeframes and asset classes.
🟢 How It Works
The indicator's key insight lies in its time-price velocity calculation system, where velocity is measured using the fundamental physics formula:
velocity = priceChange / timeWeight
The system normalizes this raw velocity against typical price movement using Average True Range (ATR) to create market-adjusted readings:
normalizedVelocity = typicalMove > 0 ? velocity / typicalMove : 0
where "typicalMove = ta.atr(lookback)" provides the baseline for normal price movement over the specified lookback period.
The Time-Price Velocity indicator calculation combines multiple sophisticated components. First, it calculates acceleration as the change in velocity over time:
acceleration = normalizedVelocity - normalizedVelocity
Then, the signal generation applies EMA smoothing to reduce noise while preserving responsiveness:
signal = ta.ema(normalizedVelocity, smooth)
This creates a velocity-based momentum indicator that combines price displacement analysis with statistical normalization, providing traders with both directional signals and acceleration insights for enhanced market timing.
🟢 How to Use
1. Signal Interpretation and Threshold Zones
Positive Values (Above Zero): Time-price velocity indicating bullish momentum with upward price displacement relative to normalized baseline
Negative Values (Below Zero): Time-price velocity indicating bearish momentum with downward price displacement relative to normalized baseline
Zero Line Crosses: Velocity transitions between bullish and bearish regimes, indicating potential trend changes or momentum shifts
Upper Threshold Zone: Area above positive threshold (default 1.0) indicating strong bullish velocity and potential reversal point
Lower Threshold Zone: Area below negative threshold (default -1.0) indicating strong bearish velocity and potential reversal point
2. Acceleration Analysis and Visual Features
Acceleration Columns: Background histogram showing velocity acceleration (the rate of change of velocity), with green columns indicating accelerating velocity and red columns indicating decelerating velocity. The interpretation depends on trend context: red columns in downtrends indicate strengthening bearish momentum, while red columns in uptrends indicate weakening bullish momentum
Acceleration Column Height: The height of each column represents the magnitude of acceleration, with taller columns indicating stronger acceleration or deceleration forces
Bar Coloring: Optional price bar coloring matches velocity direction for immediate visual trend confirmation
Info Table: Real-time display of current velocity and acceleration values with trend arrows and change indicators
3. Additional Features:
Confirmed vs Live Data: Toggle between confirmed (closed) bar analysis for stable signals or current bar inclusion for real-time updates
Multi-timeframe Adaptability: Velocity normalization ensures consistent readings across different chart timeframes and asset volatilities
Alert System: Built-in alerts for threshold crossovers and direction changes
🟢 Examples with Preconfigured Settings
Default : Balanced configuration suitable for most timeframes and general trading applications, providing optimal balance between sensitivity and noise filtering for medium-term analysis.
Scalping : High sensitivity setup with shorter lookback period and reduced smoothing for ultra-short-term trades on 1-15 minute charts, optimized for capturing rapid momentum shifts and frequent trading opportunities.
Swing Trading : Extended lookback period with enhanced smoothing and higher threshold for multi-day positions, designed to filter market noise while capturing significant momentum moves on 1-4 hour and daily timeframes.

Momentum Oscillator ModifiedThis indicator is a custom momentum oscillator enhanced with True Range-adjusted price logic and dynamic Bollinger Bands, offering a refined way to track price strength, momentum shifts, and overbought/oversold extremes with reduced noise.
Key Features:
Dynamic Price Oscillator:
Measures momentum using both price change and a volatility-adjusted price for greater accuracy.
Smoothing factor lets you fine-tune the balance between responsiveness and noise filtering.
True Range-Based Volatility Adjustment:
Integrates true range calculations to adapt to current volatility, making signals more robust during different market conditions.
Adaptive Bollinger Bands:
Two sets of custom Bollinger Bands (standard and expanded) are drawn around the oscillator, adapting over time.
These bands help identify when momentum is exceptionally strong or weak relative to recent history.
Special fills dynamically highlight when the oscillator breaks above/below the bands, signaling potential trend extremes.
Customization:
Easily adjust lookback length and smoothing factor to fit your personal trading style (e.g., scalping or swing trading).
How to Use:
Watch for the oscillator crossing above the green Bollinger Bands or below the red bands for potential overbought/oversold or breakout scenarios.
Expanded bands provide a "super extreme" zone which may hint at exhaustion or trend climax.
The dynamic mean (black line) gives a visual reference for the normalized momentum level.

EMA 20/50/200 - M3EDGE Clean Mode™The M3EDGE Clean Mode™ indicator is designed to spot the cleanest, most aligned market phases.
It filters out market noise and highlights only the high-probability trending zones where the odds are in your favor.
How it works:
• Tracks 3 key EMAs (20, 50, 200)
• Confirms directional alignment across short, medium, and long-term trends
• Colors optimal market phases to identify high-probability setups
• Optional display of the dynamic EMA50/EMA200 zone to visualize the trend’s core
Purpose:
🎯 Avoid choppy, sideways market conditions
🎯 Focus only on smooth, directional price moves
🎯 Reduce false signals and improve chart clarity
Best use cases:
• Ideal for scalping, day trading, and swing trading
• Works on all markets: indices, commodities, forex, crypto
• Perfect when combined with macro analysis and other M3EDGE™ setups
💡 Pro tip: The M3EDGE Clean Mode™ isn’t just another indicator — it’s a quality filter that keeps you out of messy conditions. When it lights up, you know the road ahead is clear.

MA Crossover Detector
The Moving Average Crossover Detector is a custom indicator that visually shows buy and sell signals clearly on the chart. based on the crossing of two moving averages — a popular and beginner-friendly tool in technical analysis.
It plots two moving averages — One fast (short period) and one slow (long period) — and highlights crossover points:
✅ Buy Signal (Golden Cross) – When the fast MA crosses above the slow MA.
❌ Sell Signal (Death Cross) – When the fast MA crosses below the slow MA.
✅ Features
Visual: Clearly shows crossovers on the chart.
Customizable: Choose periods, types, styles, etc.
Alert-ready: You can set alerts for crossovers.
The Moving Average (MA) Crossover Strategy is one of the simplest and most widely used strategies in technical analysis for trading stocks, forex, crypto, and other markets. It relies on the interaction between two moving averages to generate buy and sell signals.
Core Components
Short-Term Moving Average (Fast MA) : Reacts quickly to price changes (e.g., 9-period or 20-period).
Long-Term Moving Average (Slow MA) : Reacts more slowly to price changes (e.g., 21-period or 200-period).
How the Strategy Works
Bullish Crossover (Golden Cross):
Occurs when the fast MA crosses above the slow MA. Interpreted as a buy signal, indicating a potential uptrend.
Bearish Crossover (Death Cross):
Occurs when the fast MA crosses below the slow MA. Interpreted as a sell signal, indicating a potential downtrend.
Common Variants
Short-term trading
9 EMA
21 EMA
Swing trading
20 SMA
50 SMA
Long-term investing
50 SMA
200 SMA
Pros
Easy to understand and implement
Works well in trending markets
Can be automated for backtesting and execution
Cons
Lagging indicator: MAs are based on past prices, so signals come after the move has started.
Choppy markets = whipsaws: Generates false signals in sideways/range-bound conditions.
May underperform in volatile or mean-reverting environments
Tips for Improvement
Use confirmation tools : e.g., RSI, MACD, volume analysis, price action
Add filters : Trend filter (ADX), volatility filter (ATR), or time filter (session-based)
Combine with price structure : Support/resistance, breakouts, pullbacks

Dynamic S/R System - Pivot + ChannelDynamic S/R System - Pivot + Channel
A comprehensive Support & Resistance indicator combining dual methodologies for institutional-grade price level analysis
📊 CORE FEATURES
Dual Detection System
• Pivot-Based Levels - Historical turning points with intelligent touch counting
• Dynamic Channel S/R - Trend-aware linear regression boundaries
• Smart Level Management - Auto-merges similar levels, removes weak/outdated ones
Volume Integration
• Multi-timeframe volume analysis using EMA oscillator and spike detection
• Volume confirmation for all breakout signals to filter false moves
• Real-time volume status (Normal/High/Spike) in live information panel
Intelligent Touch Counting
• Automatic level validation through touch frequency analysis
• Strength classification with visual differentiation (colors/thickness)
• Level labels showing exact touch count (S3, R5, etc.)
━━━━━━━━━━━━━━━━━━━━━━━━━━━━━━━━━━━━━━━━━━━━━━━━━━━━━━━━━━━━━━━━━━━━━━━━━━━━━━━
🎨 VISUAL ELEMENTS
Line System
Solid Lines: Pivot-based S/R levels
Dashed Lines: Dynamic channel boundaries
Color Coding:
• 🔵 Blue/🔴 Red: Standard support/resistance
• 🟠 Orange: Strong levels (multiple touches)
• 🟣 Purple: Channel S/R levels
Signal Labels
• "B" - Pivot S/R breakout with volume confirmation
• "CB" - Channel boundary breakout
• "Bull/Bear Wick" - False breakout detection (wick rejections)
Information Panel
Real-time analysis displays:
• Total resistance/support levels detected
• Closest S/R levels to current price
• Volume status and position relative to levels
• Current market position assessment
━━━━━━━━━━━━━━━━━━━━━━━━━━━━━━━━━━━━━━━━━━━━━━━━━━━━━━━━━━━━━━━━━━━━━━━━━━━━━━━
✅ KEY ADVANTAGES
Multi-Method Validation
Combines historical pivot analysis with dynamic trend channels for comprehensive market view
False Breakout Protection
• Volume confirmation requirements
• Wick analysis to identify failed attempts
• Multiple validation criteria before signal generation
Adaptive Level Management
• Automatically updates as new pivots form
• Removes outdated/weak levels
• Maintains clean, relevant level display
Institutional-Grade Analysis
• Touch counting reveals institutional respect levels
• Volume integration shows smart money activity
• Strength classification identifies high-probability zones
━━━━━━━━━━━━━━━━━━━━━━━━━━━━━━━━━━━━━━━━━━━━━━━━━━━━━━━━━━━━━━━━━━━━━━━━━━━━━━━
⏰ OPTIMAL USE CASES
Best Timeframes
• Daily - Primary recommendation for swing trading
• 4-Hour - Intraday analysis and entries
• Weekly - Long-term position planning
Ideal Markets
• Crypto pairs (especially ETH/BTC, BTC/USD)
• Forex majors with good volume data
• Large-cap stocks with institutional participation
Trading Applications
• Entry/exit planning around key S/R levels
• Breakout confirmation with volume validation
• Risk management using nearest S/R for stops
• Trend analysis through channel dynamics
━━━━━━━━━━━━━━━━━━━━━━━━━━━━━━━━━━━━━━━━━━━━━━━━━━━━━━━━━━━━━━━━━━━━━━━━━━━━━━━
⚙️ CONFIGURATION GUIDELINES
Conservative Setup (Higher Confidence)
Min Pivot Strength: 3-4
Volume Threshold: 25-30%
Max Levels: 6-8
Aggressive Setup (More Signals)
Min Pivot Strength: 2
Volume Threshold: 15-20%
Max Levels: 10-12
🔔 ALERT SYSTEM
Breakout Alerts
• Resistance/Support breaks with volume confirmation
• Channel boundary violations
• Approaching strong S/R levels
Advanced Notifications
• Strong level approaches (within 0.5% of price)
• False breakout detection
• Volume spike confirmations
📈 TRADING STRATEGY GUIDE
Entry Strategy
1. Wait for price to approach identified S/R level
2. Confirm with volume analysis (spike/high volume preferred)
3. Watch for wick formations indicating rejection
4. Enter on confirmed breakout with volume or bounce with rejection
Risk Management
• Use nearest S/R level for stop placement
• Scale position size based on level strength (touch count)
• Monitor volume confirmation for exit signals
Market Context
• Combine with higher timeframe trend analysis
• Consider overall market sentiment and volatility
• Use channel direction for bias confirmation
Transform complex S/R analysis into actionable trading intelligence with institutional-level insights for professional trading decisions.

Elite MA Trend Overlay [9/21/50/200 + VWAP + HMA]🔍 What It Is:
The Elite MA Trend Overlay is a professional-grade moving average system built for day traders, scalpers, and swing traders who need clear, visual trend confirmation and precise entry zones across all timeframes.
This overlay combines 5 industry-proven tools into one compact indicator for sniper-level decision making:
EMA 9 – Entry momentum
EMA 21 – Microstructure guide
EMA 50 – Trend bias filter
EMA 200 – Institutional macro direction
VWAP – Intraday fair value (used by pros)
Hull MA (HMA) – Early shift detector
It also features auto-detected trend zones using color-coded background shading to help you instantly know if the market is in a bullish or bearish regime.
🧠 How It Works:
The script dynamically plots the short-term to long-term moving averages to reflect real-time market structure. When all EMAs are aligned in one direction, a colored background highlights the dominant trend:
✅ Green background = Bullish trend (9 > 21 > 50 > 200)
🔻 Red background = Bearish trend (9 < 21 < 50 < 200)
The VWAP line acts as a magnet and decision zone—traders use it for intraday entries or exits. The Hull Moving Average adapts quickly to price shifts, making it perfect for spotting early reversals before the EMAs cross.
🎯 Why It Helps Traders Succeed:
This indicator:
Removes guesswork: Know instantly if you’re in a strong trend or chop zone.
Filters bad trades: Avoid entering against structure or into volatility traps.
Improves timing: Use pullbacks to EMAs or Hull MA flips for sniper entries.
Works across timeframes: From scalping 1-minute to swing trading daily charts.
Whether you're trading gold, forex, stocks, or crypto — this overlay gives you clean, professional structure that keeps you disciplined and sharp.
⚙️ Features:
On/off toggles for VWAP & Hull MA
Minimalist, clutter-free plotting
Auto background color zones
Supports Pine Script v6 (latest version)
👑 Recommended Use:
Confirm trend with background + EMA alignment
Enter on pullbacks to EMA 21 or 50
Use Hull MA or RSI for early reversal detection
Exit at VWAP reversion or trend exhaustion
💬 “Structure is everything. Trade with the flow, not against it.”

Momentum DivergenceOverview
The Momentum Divergence Oscillator is a valuable tool designed for traders who are familiar with basic charting but want to deepen their market insights. This indicator combines a momentum calculation with divergence detection, presenting the data in an intuitive way with a blue momentum line and colored divergence signals ("Bull" and "Bear"). It’s perfect for refining entry and exit points across various timeframes, especially for scalping or swing trading strategies.
Understanding the Concepts
What is Momentum?
Momentum measures the speed and strength of a price movement by comparing the current closing price to a previous close over a set period. In this indicator, it’s calculated as the difference between the current close and the close from a user-defined number of bars ago (default: 10). A rising momentum line indicates accelerating upward momentum, while a falling line suggests slowing momentum or a potential reversal. This helps you gauge whether a trend is gaining power or losing steam, making it a key indicator for spotting overbought or oversold conditions.
What is a Divergence?
A divergence occurs when the price action and the momentum indicator move in opposite directions, often signaling a potential trend reversal. The Momentum Divergence Oscillator highlights two types:
Bullish Divergence: When the price forms a lower low (indicating weakness), but the momentum shows a higher low (suggesting underlying strength). This can foreshadow an upward reversal.
Bearish Divergence: When the price reaches a higher high (showing strength), but the momentum records a lower high (indicating fading momentum). This may hint at an impending downward turn.
How the Indicator Works
The indicator plots a momentum line in a separate pane below your chart, giving you a clear view of price momentum over time. It also scans for divergences using adjustable lookback periods (default: 5 bars left and right) and a range window (default: 5-60 bars) to ensure relevance. When a divergence is detected, it’s visually highlighted, and you can customize the sensitivity through input settings like the momentum length and pivot lookback. Alerts are included to notify you of new divergence signals in real-time, saving you from constant monitoring.
How to Apply It
Identifying Opportunities: Use bullish divergences ("Bull") as a cue to consider long positions, especially when confirmed by support levels or a moving average crossover. Bearish divergences ("Bear") can signal short opportunities, particularly near resistance zones.
Combining with Other Tools: Pair this oscillator with indicators like the Relative Strength Index (RSI) or volume analysis to filter out false signals and increase confidence in your trades. For example, a bullish divergence with rising volume can be a stronger buy signal.
Timeframe Flexibility: Test it on shorter timeframes (e.g., 5-minute charts) for quick scalping trades or longer ones (e.g., 1-hour or 4-hour charts) for swing trading, adjusting the momentum length to suit the market’s pace.
Alert Setup: Enable the built-in alerts to get notified when a divergence forms, allowing you to react promptly without staring at the screen all day.
Strategy Example
Spot a bullish divergence on a 15-minute chart where the price hits a lower low, but the momentum rises.
Confirm with a break above a 20-period EMA and increasing volume.
Enter a long position with a stop-loss below the recent low and a take-profit near the next resistance level.
Customization Tips
Adjust the "Momentum Length" (default: 10) to make the oscillator more or less sensitive—shorter lengths react faster, while longer ones smooth out noise.
Tweak the "Pivot Lookback" settings to widen or narrow the divergence detection range based on your trading style.
Use the "Range Upper/Lower" inputs to focus on divergences within a specific timeframe that matches your strategy.
Important Considerations
b]This indicator is a technical analysis tool, not a guaranteed trading system. Always pair it with a solid strategy and strict risk management, such as setting stop-losses.
In strong trending markets, divergences can sometimes produce false signals. Consider adding a trend filter (e.g., ADX below 25) to avoid whipsaws.
Experiment with the settings on a demo account or backtest to find what works best for your preferred markets and timeframes.

SwingTrade ADX Strategy v6This is a swing trading strategy that combines VWAP (Volume Weighted Average Price), ADX (Average Directional Index) for trend strength, and volume ratios to generate long/short entry and exit signals. It's designed for daily charts but can be adapted.
#### Key Features:
- **Entries**: Based on VWAP crossovers, rising/falling delta (price deviation from VWAP), ADX trend confirmation, and volume ratios.
- **Exits**: Dynamic exits when VWAP delta reverses after a peak.
- **Filters**: Optional toggles for VWAP signals, ADX, and volume. Backtest date range for custom periods.
- **Visuals**: VWAP line, signal shapes/labels, and an info panel showing key metrics (VWAP Delta %, ADX, Volume Ratio).
- **Alerts**: Built-in alerts for buy/sell entries and exits.
#### How to Use:
1. Apply to your chart (e.g., stocks, forex, crypto).
2. Adjust parameters in the settings (e.g., ADX threshold, volume period).
3. Enable/disable indicators as needed.
4. Backtest using the date filters and review equity curve.
**Disclaimer**: This is for educational purposes only. Past performance is not indicative of future results. Not financial advice—trade at your own risk. Backtest thoroughly and use with proper risk management.
Feedback welcome! If you find it useful, give it a like.

Stochastic Ribbon & EMAsHere's a comprehensive description for publishing your indicator:
---
# **Stochastic Ribbon & EMAs**
A clean and powerful trading indicator that combines **Stochastic Support/Resistance levels** with **Essential Moving Averages** for comprehensive market analysis.
## **📊 What It Does**
This indicator provides **7 key reference lines** on your chart:
- **3 Stochastic levels** (20%, 50%, 80%) - Dynamic support/resistance zones
- **4 Essential EMAs** (20, 50, 100, 200) - Trend direction and momentum
## **🎯 Key Features**
### **Stochastic Ribbon (3 Yellow Lines)**
- **80% Line**: Dynamic resistance level - potential selling zone
- **50% Line**: Market equilibrium - trend direction reference
- **20% Line**: Dynamic support level - potential buying zone
- **Default 50-period lookback** for stable, reliable levels
- **All lines in yellow** for clean, consistent visualization
### **Essential EMAs (4 Colored Lines)**
- **20 EMA** (Purple): Short-term trend and entry timing
- **50 EMA** (Dark Cyan): Medium-term trend direction
- **100 EMA** (Rosy Brown): Long-term trend confirmation
- **200 EMA** (Brown): Major trend and institutional levels
## **📈 How to Use**
### **For Support & Resistance:**
- **Above 80% line**: Look for selling opportunities (overbought zone)
- **Between 50-80%**: Bullish bias, pullbacks to 50% line for entries
- **Around 50% line**: Key equilibrium - watch for direction
- **Between 20-50%**: Bearish bias, bounces to 50% line for exits
- **Below 20% line**: Look for buying opportunities (oversold zone)
### **For Trend Analysis:**
- **EMA Stack Order**: Higher timeframe EMAs above lower = uptrend
- **Price above all EMAs**: Strong bullish momentum
- **Price below all EMAs**: Strong bearish momentum
- **EMA as dynamic support/resistance**: Bounces and rejections
### **For Entry Signals:**
- **Confluence zones**: Where Stochastic levels meet EMA levels
- **Breakouts**: Price breaking through multiple levels simultaneously
- **Reversals**: Price rejection at extreme Stochastic levels with EMA confirmation
## **⚙️ Settings**
### **Stochastic Ribbon**
- **Show/Hide**: Toggle the 3 Stochastic lines
- **Length**: Period for high/low calculation (default: 50)
- **Start**: Multiplier for calculation (default: 1)
### **EMAs**
- **Individual toggles**: Show/hide each EMA separately
- **Custom periods**: Adjust each EMA length (defaults: 20, 50, 100, 200)
- **Custom colors**: Personalize each EMA color
## **🚀 Why This Indicator?**
✅ **Clean & Simple**: No cluttered charts - just essential levels
✅ **Multi-Timeframe**: Works on all timeframes from 1m to 1W
✅ **Versatile**: Suitable for scalping, day trading, and swing trading
✅ **Low Lag**: Dynamic levels that adapt to current market conditions
✅ **Proven Components**: Combines two well-established technical concepts
✅ **Customizable**: Adjust all parameters to fit your trading style
## **💡 Pro Tips**
- **Use multiple timeframes**: Check higher timeframe alignment for stronger signals
- **Combine with volume**: Look for volume confirmation at key levels
- **Watch for confluences**: Best signals occur where multiple levels align
- **Respect the 50% line**: Often acts as the most important level for trend direction
## **📋 Technical Details**
- **Version**: Pine Script v5
- **Overlay**: Yes (displays on main price chart)
- **Plots**: 7 total (well within Pine Script limits)
- **Performance**: Optimized for fast loading and smooth operation
---
**Perfect for traders who want clear, actionable levels without chart clutter. Whether you're a beginner learning support/resistance or an experienced trader looking for clean reference points, this indicator delivers exactly what you need.**
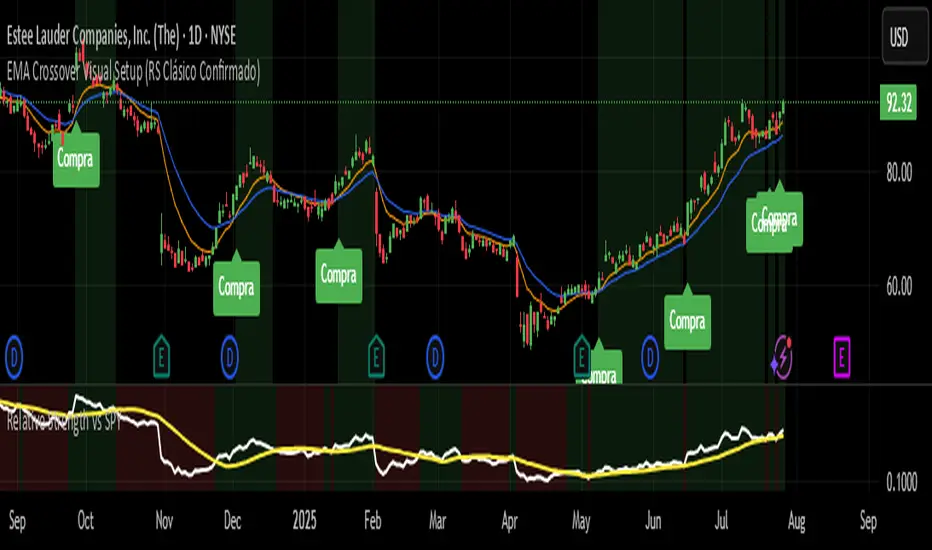
EMA Crossover Visual Setup (RS Clásico Confirmado)Overview
This script is designed to visually highlight classic swing trading setups based on the crossover of exponential moving averages (EMAs), with additional confirmation using Relative Strength (RS) compared to a benchmark asset (e.g., SPY).
The goal is to identify bullish momentum shifts that align both with technical structure (EMA crossover) and relative outperformance, helping traders focus on strong stocks in strong markets.
Logic
A signal is triggered when the following conditions are met:
The fast EMA (e.g., 10) crosses above the slow EMA (e.g., 20).
The closing price is above a third EMA (e.g., 50) to confirm bullish structure.
The asset's Relative Strength (RS) versus a benchmark is confirmed manually, based on an RSI comparison (not calculated inside the script).
The script is meant to be used alongside manual RS confirmation, using a secondary chart or overlay of the RS ratio.
Features
Visual labels and markers for clean charting of valid entry setups
Fully customizable EMA lengths
Optional highlighting of candle patterns near entry
Ideal for use with top-down analysis and watchlist filtering
Suggested Use
Works best on daily and 4H charts for swing trading setups
Combine with volume and price action analysis for higher probability trades
Use manual RS validation: confirm that the RSI of the selected stock is stronger than the RSI of SPY (or any benchmark of your choice)
Notes
This script does not execute trades or include stop loss/take profit logic, as it is intended for discretionary traders who want to visually scan for opportunities.
It also does not calculate RS internally, allowing flexibility in how you define strength (RS line, RSI comparison, or price ratio).
Trigonometric StochasticTrigonometric Stochastic - Mathematical Smoothing Oscillator
Overview
A revolutionary approach to stochastic oscillation using sine wave mathematical smoothing. This indicator transforms traditional stochastic calculations through trigonometric functions, creating an ultra-smooth oscillator that reduces noise while maintaining sensitivity to price changes.
Mathematical Foundation
Unlike standard stochastic oscillators, this version applies sine wave smoothing:
• Raw Stochastic: (close - lowest_low) / (highest_high - lowest_low) × 100
• Trigonometric Smoothing: 50 + 50 × sin(2π × raw_stochastic / 100)
• Result: Naturally smooth oscillator with mathematical precision
Key Features
Advanced Smoothing Technology
• Sine Wave Filter: Eliminates choppy movements while preserving signal integrity
• Natural Boundaries: Mathematically constrained between 0-100
• Reduced False Signals: Trigonometric smoothing filters market noise effectively
Traditional Stochastic Levels
• Overbought Zone: 80 level (dashed line)
• Oversold Zone: 20 level (dashed line)
• Midline: 50 level (dotted line) - equilibrium point
• Visual Clarity: Clean oscillator panel with clear level markings
Smart Signal Generation
• Anti-Repaint Logic: Uses confirmed previous bar values
• Buy Signals: Generated when crossing above 30 from oversold territory
• Sell Signals: Generated when crossing below 70 from overbought territory
• Crossover Detection: Precise entry/exit timing
Professional Presentation
• Separate Panel: Dedicated oscillator window (overlay=false)
• Price Format: Formatted as price indicator with 2-decimal precision
• Theme Adaptive: Automatically matches your chart color scheme
Parameters
• Cycle Length (5-200): Period for highest/lowest calculations
- Shorter periods = more sensitive, more signals
- Longer periods = smoother, fewer but stronger signals
Trading Applications
Momentum Analysis
• Overbought/Oversold: Clear visual identification of extreme levels
• Momentum Shifts: Early detection of momentum changes
• Trend Strength: Monitor oscillator position relative to midline
Signal Trading
• Long Entries: Buy when crossing above 30 (oversold bounce)
• Short Entries: Sell when crossing below 70 (overbought rejection)
• Confirmation Tool: Use with trend indicators for higher probability trades
Divergence Detection
• Bullish Divergence: Price makes lower lows, oscillator makes higher lows
• Bearish Divergence: Price makes higher highs, oscillator makes lower highs
• Early Warning: Spot potential trend reversals before they occur
Trading Strategies
Scalping (5-15min timeframes)
• Use cycle length 10-14 for quick signals
• Focus on 20/80 level bounces
• Combine with price action confirmation
Swing Trading (1H-4H timeframes)
• Use cycle length 20-30 for reliable signals
• Wait for clear crossovers with momentum
• Monitor divergences for reversal setups
Position Trading (Daily+ timeframes)
• Use cycle length 50+ for major signals
• Focus on extreme readings (below 10, above 90)
• Combine with fundamental analysis
Advantages Over Standard Stochastic
1. Smoother Action: Sine wave smoothing reduces whipsaws
2. Mathematical Precision: Trigonometric functions provide consistent behavior
3. Maintained Sensitivity: Smoothing doesn't compromise signal quality
4. Reduced Noise: Cleaner signals in volatile markets
5. Visual Appeal: More aesthetically pleasing oscillator movement
Best Practices
• Market Context: Consider overall trend direction
• Multiple Timeframe: Confirm signals on higher timeframes
• Risk Management: Always use proper position sizing
• Backtesting: Test parameters on your preferred instruments
• Combination: Works excellently with trend-following indicators
Built-in Alerts
• Buy Alert: Trigonometric stochastic oversold crossover
• Sell Alert: Trigonometric stochastic overbought crossunder
Technical Specifications
• Pine Script Version: v6
• Panel: Separate oscillator window
• Format: Price indicator with 2-decimal precision
• Performance: Optimized for all timeframes
• Compatibility: Works with all instruments
Free and open-source indicator. Modify, improve, and share with the community!
Educational Value: Perfect for traders wanting to understand how mathematical smoothing improves oscillators and trigonometric applications in technical analysis.

Trigonometric Sine Cosine WavesTrigonometric Sine Cosine Waves - Advanced Cyclical Analysis
Overview
This innovative indicator applies trigonometric mathematics to market analysis, generating dynamic sine and cosine waves that adapt to price movement and volatility. Unlike traditional oscillators, this tool visualizes market cycles directly on your chart using mathematical wave functions.
How It Works
The indicator calculates phase-based waves using:
• Phase Calculation: 2π × bar_index / cycle_length
• Adaptive Amplitude: EMA-based price + ATR volatility scaling
• Sine Wave: avgPrice + volatility × sin(phase)
• Cosine Wave: avgPrice + volatility × cos(phase)
Key Features
Dynamic Wave Generation
• Sine Wave: Primary cycle indicator with smooth transitions
• Cosine Wave: Leading indicator (90° phase difference from sine)
• Adaptive Amplitude: Automatically adjusts to market volatility using ATR
Turning Point Detection
• Anti-Repaint Signals: Uses confirmed values from previous bars
• Sine Bottom: Potential buy zones when wave transitions from down to up
• Sine Top: Potential sell zones when wave transitions from up to down
Advanced Analytics
• Price Correlation Angle: Shows relationship between price movement and cycle
• Phase Information: Current position in the mathematical cycle
• Real-time Values: Live sine/cosine values and phase degrees
Visual Enhancement
• Background Coloring: Changes based on sine wave position (above/below zero)
• Clean Overlay: Waves plot directly on price chart without cluttering
Parameters
• Cycle Length (5-200): Controls wave frequency - shorter = more sensitive
• Amplitude Multiplier (0.1-5.0): Adjusts wave height relative to volatility
• Display Options : Toggle sine wave, cosine wave, and correlation table
• Show Correlation : Optional table showing mathematical values
Trading Applications
Cycle Analysis
• Identify market rhythm and timing
• Spot potential reversal zones
• Understand price-to-cycle relationships
Entry/Exit Timing
• Buy Signals: Sine wave bottoms (cycle lows)
• Sell Signals: Sine wave tops (cycle highs)
• Confirmation: Use with other indicators for higher probability setups
Market Structure
• Visualize underlying market cycles
• Identify periods of high/low cyclical activity
• Track phase relationships between price and mathematical cycles
Pro Tips
1. Longer cycles (50-100) work better for swing trading
2. Shorter cycles (10-20) suitable for scalping
3. Combine with volume for stronger signal confirmation
4. Monitor correlation angle for trend strength assessment
5. Use background color as quick visual cycle reference
Important Notes
• Signals are anti-repaint using confirmed previous bar values
• Best used in trending or cyclical markets
• Consider market context when interpreting signals
• Mathematical approach - not based on traditional TA concepts
Alerts Included
• Sine Wave Buy Signal: Triggered on wave bottom detection
• Sine Wave Sell Signal: Triggered on wave top detection
Technical Requirements
• Pine Script v6
• Works on all timeframes
• No external dependencies
• Optimized for performance
This is a free, open-source indicator. Feel free to modify and improve according to your trading needs!
Educational Value: Perfect for understanding how mathematical functions can be applied to market analysis and cycle detection.

UngliMulti-Indicator Confluence System
This is a **multi-indicator confluence trading signal system** called "Ungli" that combines RSI, ADX, and MACD to identify high-probability momentum opportunities when used alongside chart pattern and trend line breakouts.
## Core Concept
The script identifies moments when multiple technical indicators align to suggest potential price momentum moves, specifically looking for oversold and overbought conditions with momentum confirmation. Use green and red highlights along with chart patterns and trend line breakouts that signal a breakout for confluence for a likely momentum move.
## Technical Indicators Used
**RSI (Relative Strength Index)**
- Default 14-period RSI
- Oversold threshold: < 40
- Overbought threshold: > 60
**ADX (Average Directional Index)**
- Default 14-period ADX with DI+ and DI-
- Threshold: 21
- Looks for ADX below threshold but ticking upward (momentum building)
**MACD (Moving Average Convergence Divergence)**
- Fast: 12, Slow: 26, Signal: 9
- Uses MACD line direction as trend filter
## Signal Logic
**Green Background (Bullish Momentum Signal):**
- RSI > 60 (overbought)
- ADX < 21 AND rising
- MACD line trending upward
**Red Background (Bearish Momentum Signal):**
- RSI < 40 (oversold)
- ADX < 21 AND rising
- MACD line trending downward
## Key Strategy Elements
1. **Confluence Approach**: Requires all three indicators to align, reducing false signals
2. **Momentum Filter**: ADX must be building (rising) even if low, indicating emerging trend strength
3. **Trend Confirmation**: MACD direction must match the expected move
4. **Visual Simplicity**: Clean background highlighting without chart clutter
5. **Pattern Integration**: Designed to work with chart patterns and breakout strategies
## Use Case
This indicator is designed for swing trading and breakout strategies, identifying moments when oversold/overbought conditions coincide with building momentum in the expected direction. The ADX filter helps avoid choppy, trendless markets. Best used in conjunction with:
- Support/resistance breakouts
- Chart pattern breakouts (triangles, flags, channels)
- Trend line breaks
- Key level violations
The background highlights serve as confluence confirmation when combined with your chart analysis and breakout setups.